lineshape
Short description
Calculate the frequency-dependent self-energy and phonon spectral function from many-body perturbation theory.
Command line options:
Optional switches:
-
--unit value, value in:thz,mev,icm
default value thz
Choose the output unit. The options are terahertz (in frequency, not angular frequency), inverse cm or meV. -
--temperature value
default value 300
Temperature used in the occupation numbers. Should be the same as the temperature the force constants where determined at. -
--n_energies value,-ne value
default value 1200
Number of energies for the energy-dependent self-energy. -
--qpoint_grid value#1 value#2 value#3,-qg value#1 value#2 value#3
default value 26 26 26
Density of q-point mesh for Brillouin zone integrations. -
--integrationtype value,-it value, value in:1,2,3
default value 2
Type of integration for the phonon DOS. 1 is Gaussian, 2 adaptive Gaussian and 3 Tetrahedron. -
--sigma value
default value 1.0
Global scaling factor for the Gaussian/adaptive Gaussian smearing. The default is determined procedurally, and scaled by this number. -
--path
default value .false.
Calculate the self-energy and spectral function on a path through the BZ. -
--readpath,-rp
default value .false.
Read the q-point path frominfile.qpoints_dispersion. Use crystal structure into to generate an example. -
--nq_on_path value,-nq value
default value 100
Number of q-points between each high symmetry point -
--dos
default value .false.
Calculate the broadened and shifted phonon DOS. -
--dos_qpoint_grid value#1 value#2 value#3
default value -1 -1 -1
Interpolate to a (preferrably) denser q-mesh when calculating the DOS. -
--qpoint value#1 value#2 value#3
default value 0 0 0
Calculate the self-energy at a single q-point, input in fractional coordinates. -
--highsymmetrypoint value
default value none
Samy as above, but you can specify the label of a high-symmetry point instead, e.g. "X" or "L". -
--max_energy value
default value 1.4
Maximum energy where the output is cut off, in multiples of the maximum harmonic frequency. -
--no_isotope_scattering
default value .false.
Switch off isotope (mass disorder) scattering -
--no_thirdorder_scattering
default value .false.
Switch of three-phonon scattering -
--readiso
default value .false.
Read the isotope distribution from file -
--meshtype value, value in:1,2,3
default value 1
Type of q-point mesh. 1 Is a Monkhorst-Pack mesh, 2 an FFT mesh and 3 my fancy wedge-based mesh with approximately the same density the grid-based meshes. -
--readqmesh
default value .false.
Read the q-point mesh from file. To generate a q-mesh file, see the genkpoints utility. -
--help,-h
Print this help message -
--version,-v
Print version
Examples
mpirun lineshape --highsymmetrypoint X --temperature 500
mpirun lineshape --path -qg 10 10 10 --noisotope
mpirun lineshape --dos -qg 10 10 10 --dos_qpoint_grid 24 24 24
Long summary
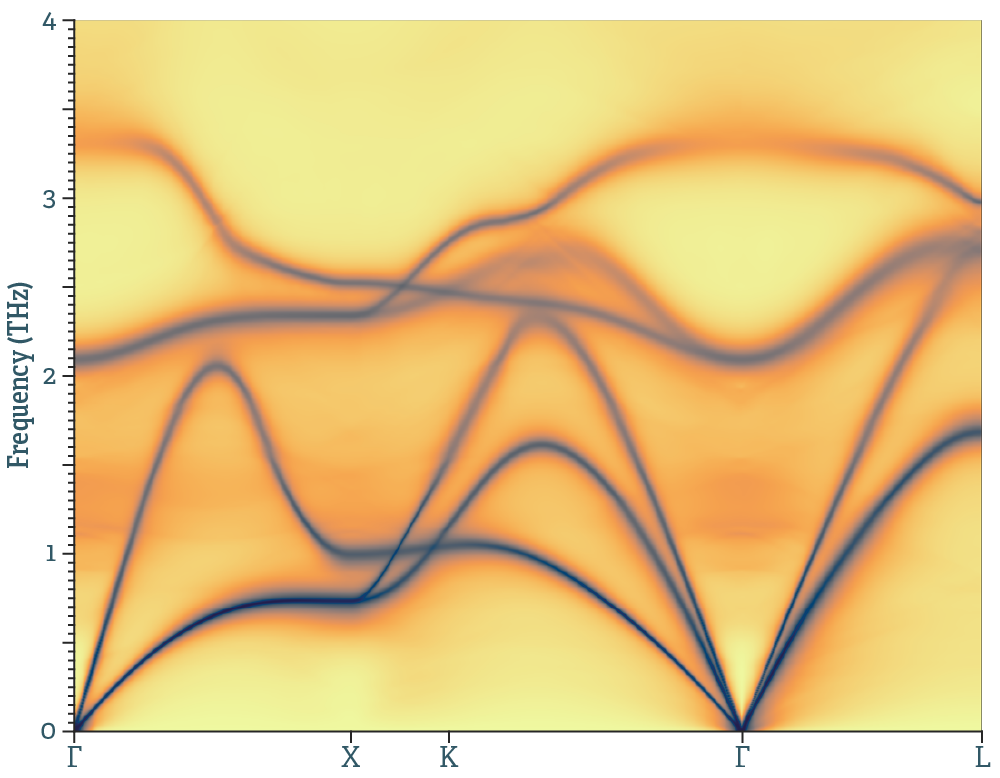
This code calculates the energy-dependent self energy from three-phonon scattering, as well as the contributions from mass imperfections and four-phonon scattering. It can produce nice figures like this:
Background
It is nowadays routine to calculate e.g. lattice thermal conductivity using perturbation theory. At that level of approximation, you calculate the phonon lifetime via the imaginary part of the phonon self-energy at the harmonic frequencies. In general, however, the picture with a well defined phonon, shifted by a small energy $ \Delta $ and broadened by $ \Gamma $ is not enough. In general, the phonon self-energy is energy-dependent,1,2
$$ \begin{equation} \Sigma(\Omega) = \Delta(\Omega) + i\Gamma(\Omega) \,, \end{equation} $$
where we use $ \Omega $ to distinguish this energy from the eigenvalues of the dynamical matrix, $ \omega^2 $. Inelastic neutron measurements sometimes show scattering cross sections that deviate strongly from a Lorentzian. To reproduce this computationally, start by noting that in an idealised experiment the one-phonon neutron cross section would be measured as1,2
$$ \begin{equation} \sigma_{\lambda}(\Omega) \propto \frac{ 2 \omega_{\lambda}\Gamma_{\lambda}(\Omega) }{ \left[\Omega^2-\omega^2_{\lambda}-2\omega_{\lambda} \Delta_{\lambda}(\Omega)\right]^2+4\omega^2_{\lambda}\Gamma_{\lambda}^2(\Omega)}\,. \end{equation} $$
Here $\omega^2_{\lambda}$ are the eigenvalues of the dynamical matrix, $\Delta_{\lambda}(\Omega)$ and $\Gamma_{\lambda}(\Omega)$ are the real and imaginary parts of the frequency dependent self-energy, and $\hbar\Omega$ is a probing energy. This is the quantity referred to as the lineshape. If you let $\Delta$ and $\Gamma$ go to a small constant, this reduces to a Lorentzian as expected.
The energy axis is the probing energy, and the intensity represents the likelihood of exciting a phonon with energy $\hbar\Omega$ and momentum $\textbf{q}$. We can interpret the cross section, or phonon lineshape, as the broadened and shifted phonon frequencies. The term "broadening" is used in the sense of a spectral representation: non-interaction quasiparticles are represented as Dirac $\delta$-functions, but in the interacting case these are replaced by distributions with finite widths.
Given the third order force constants, the imaginary part of the phonon self-energy can be calculated:1,2,4
$$ \begin{equation} \begin{split} \Gamma_{\lambda}(\Omega) & = \frac{\hbar\pi}{16} %\frac{V}{(2\pi)^3} \sum_{\lambda'\lambda''} \left| \Phi_{\lambda\lambda'\lambda''} \right|^2 \big{\{}(n_{\lambda'}+n_{\lambda''}+1) \delta(\Omega-\omega_{\lambda'}-\omega_{\lambda''})+ \\& +(n_{\lambda'}-n_{\lambda''}) \left[ \delta(\Omega-\omega_{\lambda'}+\omega_{\lambda''}) - \delta(\Omega+\omega_{\lambda'}-\omega_{\lambda''}) \right] \big{\}} \end{split} \end{equation} $$
The imaginary part of the self energy is a sum over all possible three-phonon interactions $ \lambda \lambda' \lambda''$, $n_{\lambda}$ are the Bose-Einstein thermal occupation factors counting the number of phonons in each mode. The expression for the self-energy is then an integral over the allowed processes (conserving energy and momentum), weighted by how many phonons are in each of the different modes, with the scattering strength determined by the three-phonon matrix element:
$$ \begin{equation} \Phi_{\lambda\lambda'\lambda''} = \sum_{ijk} \sum_{\alpha\beta\gamma} \frac{ \epsilon_{\lambda}^{i \alpha} \epsilon_{\lambda'}^{j \beta} \epsilon_{\lambda''}^{k \gamma} }{ \sqrt{m_{i}m_{j}m_{j}} \sqrt{ \omega_{\lambda} \omega_{\lambda'} \omega_{\lambda''}} } \Phi^{\alpha\beta\gamma}_{ijk} e^{i \mathbf{q}\cdot\mathbf{r}_i + i \mathbf{q}'\cdot\mathbf{r}_j+i \mathbf{q}''\cdot\mathbf{r}_k} \end{equation} $$
The real part is conveniently calculated via a Kramers-Kronig transform (it can of course be expressed in a similar way as the imaginary part:1,2,4
$$ \begin{equation} \Delta(\Omega)=\frac{1}{\pi}\int\frac{\Gamma(\omega)}{\omega-\Omega}\mathrm{d}\omega\,. \end{equation} $$
A significant deviation from Lorentzian lineshapes indicates anharmonic effects and can be checked by considering phonon spectral representation $\sigma_{\lambda}$.
Mass disorder
The mass disorder term is also included, stemming from the natural distribution of isotopes. According to Tamura5, if the isotopes are randomly distributed on the lattice sites then the strength of the isotope effects can be given by a mass variance parameter $g$:
$$ \begin{equation} g_i=\sum_j c_{i}^j \left(\frac{m_i^j-\bar{m_i}}{\bar{m_i}}\right)^2 \end{equation} $$
where $\bar{m_i}$ is the average isotopic mass( $\bar{m_i}=\sum_j c_i^j m_i^j$ ), $m^j_i$ is the mass of isotope $j$ of atom $i$ and $c^j_i$ is its concentration. We can write an expression for the imaginary part of the isotope self-energy:
$$ \begin{equation} \Gamma_{\lambda}(\Omega)= \frac{\pi}{4} \sum_{\lambda'} \Lambda_{\lambda\lambda'} \delta(\Omega-\omega_{\lambda}') \end{equation} $$
where
$$ \begin{equation} \Lambda_{\lambda\lambda'}= \omega_{\lambda}\omega_{\lambda'} \sum_i g_i \left| \epsilon_{\lambda}^{i \dagger} \epsilon_{\lambda'}^{i} \right|^2 \end{equation} $$
Per default, the isotope distribution will be the natural distribution. In case some other distribution is desired, this can be specified.
Input files
Required files:
Optional files:
- infile.lotosplitting (for long-range corrections)
- infile.qpoints_dispersion (to specify the q-point path)
- infile.isotopes (for non-natural isotope distribution)
Output files
There are three possible modes for this code: the lineshape at a single q-point (default), along a path in the BZ (--path) or over the full BZ as a phonon DOS (--dos). The output files will differ. For lineshape at a single q, you get
outfile.lineshape.hdf5
This file is self-documented. You can produce plots like this:
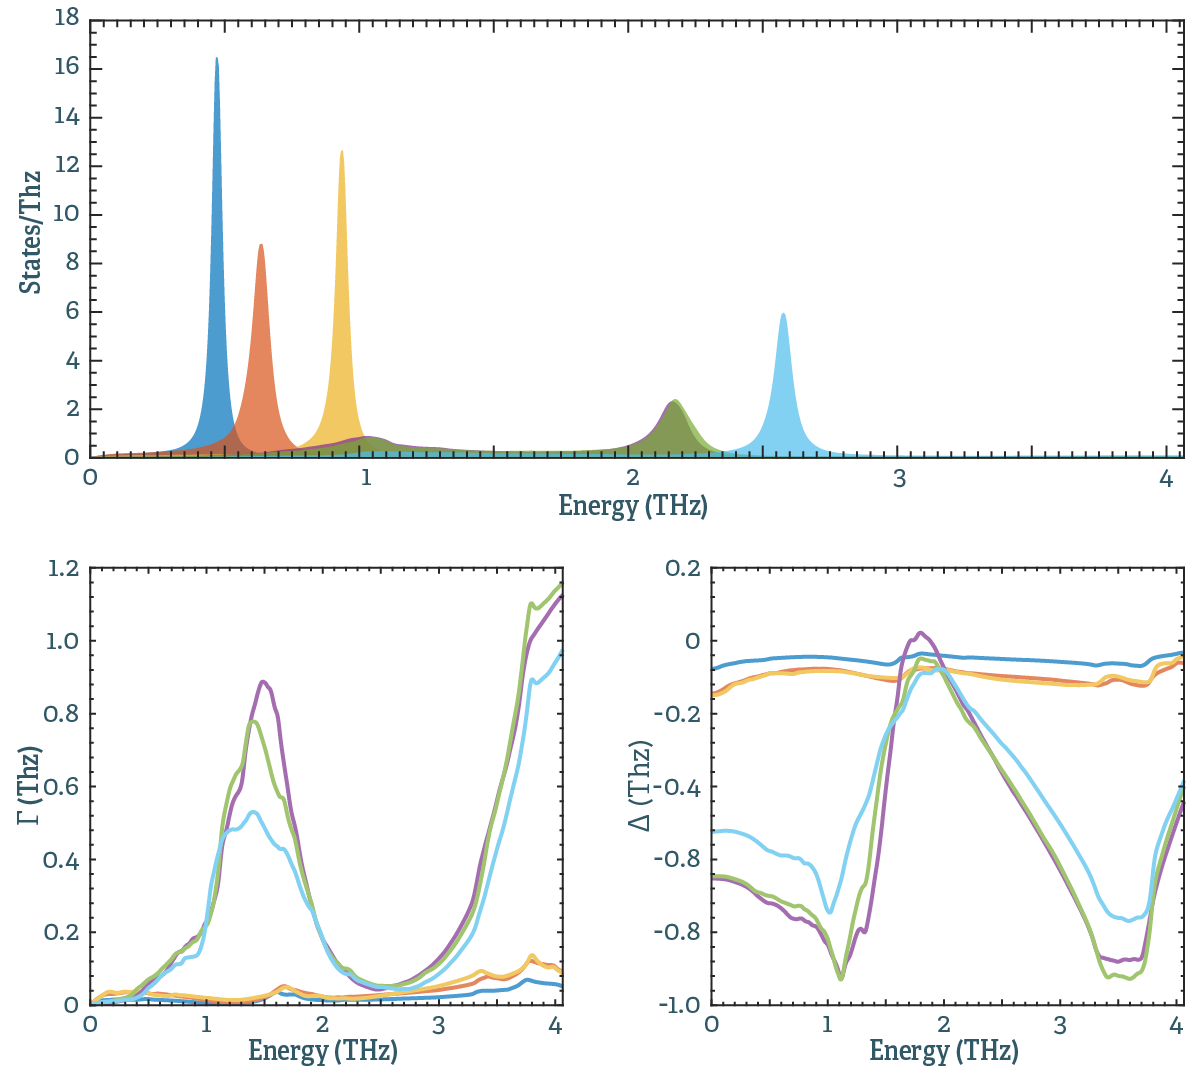
For this plot, I used the following matlab snippet:
% read everything from file
fn=('outfile.lineshape.hdf5');
% lineshape things
x1=h5read(fn,'/intensity_axis');
y1=h5read(fn,'/intensity');
% self-energies
x2=h5read(fn,'/selfenergy_axis');
z1=h5read(fn,'/imaginary_threephonon_selfenergy');
z2=h5read(fn,'/imaginary_isotope_selfenergy');
z3=h5read(fn,'/real_threephonon_selfenergy');
% and the unit and bare harmonic frequencies
energyunit=h5readatt(fn,'/selfenergy_axis','unit');
omega=h5read(fn,'/harmonic_frequencies');
% create a legend
for i=1:length(omega)
    lgd{i}=['band ' num2str(i) ', \omega = ' num2str(omega(i),'%10.5f') energyunit];
end

figure(1); clf; hold on;

subplot(2,1,1); hold on; box on;

    plot(x1,y1)
    title('Lineshape')
    xlabel(['\omega (' energyunit ')'])
    ylabel(['states/' energyunit ])
    set(gca,'xminortick','on','yminortick','on','xlim',[0 max(omega)*1.4])
    legend(lgd,'edgecolor','none')

subplot(2,2,3); hold on; box on;
    plot(x2,z1+z2)
    title('Imaginary self-energy')
    xlabel(['\omega (' energyunit ')'])
    ylabel(['\Gamma (' energyunit ')'])
    set(gca,'xminortick','on','yminortick','on','xlim',[0 max(omega)*1.4])

subplot(2,2,4); hold on; box on;
    plot(x2,z3)
    title('Real self-energy')
    xlabel(['\omega (' energyunit ')'])
    ylabel(['\Delta (' energyunit ')'])
    set(gca,'xminortick','on','yminortick','on','xlim',[0 max(omega)*1.4])
outfile.sqe.hdf5
These files represent the properties calculated as a function of \(\textbf{q}\) along high symmetry directions in the Brillouin zone, such as the plot at the top of this page. The file is self-documented. An example how to produce decent-looking plots can be found here.
outfile.dos_lineshape
Is identical to this.
-
Maradudin, A. A., & Fein, A. (1962). Scattering of Neutrons by an Anharmonic Crystal. Physical Review, 128(6), 2589–2608. ↩↩↩↩
-
Cowley, R. A. (1968). Anharmonic crystals. Reports on Progress in Physics, 31(1), 123–166. ↩↩↩↩
-
Leibfried, G., & Ludwig, W. (1961). Theory of Anharmonic Effects in Crystals. Solid State Physics - Advances in Research and Applications, 12(C), 275–444. ↩
-
Wallace, D. C. (1998). Thermodynamics of crystals. Dover Publications, Incorporated. ↩↩
-
Tamura, S. (1983). Isotope scattering of dispersive phonons in Ge. Physical Review B, 27(2), 858–866. ↩